Bring it together.

Standardize on adaptability.
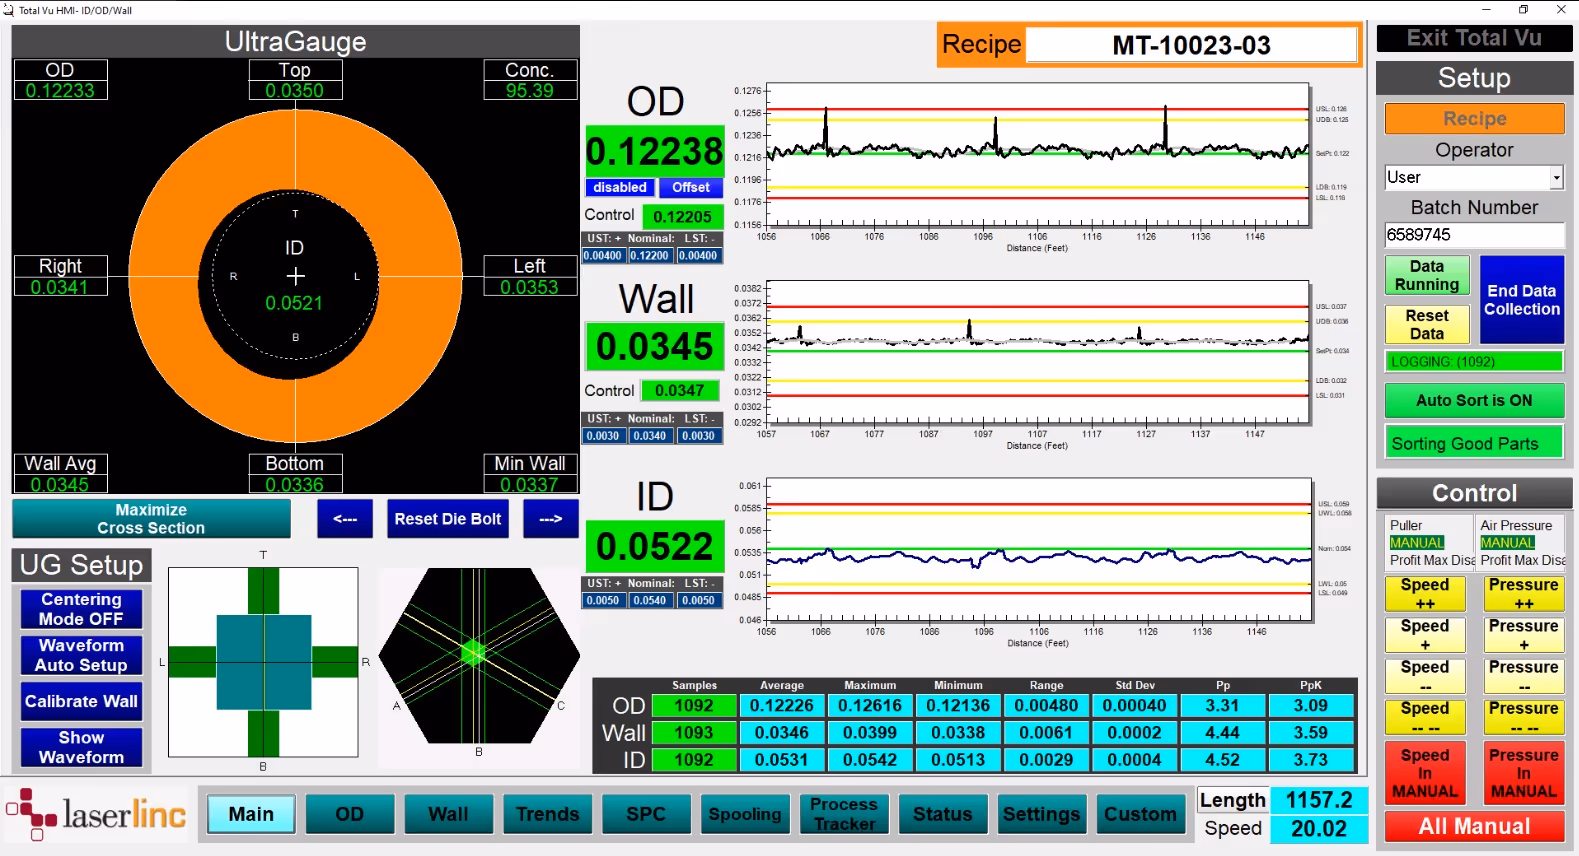
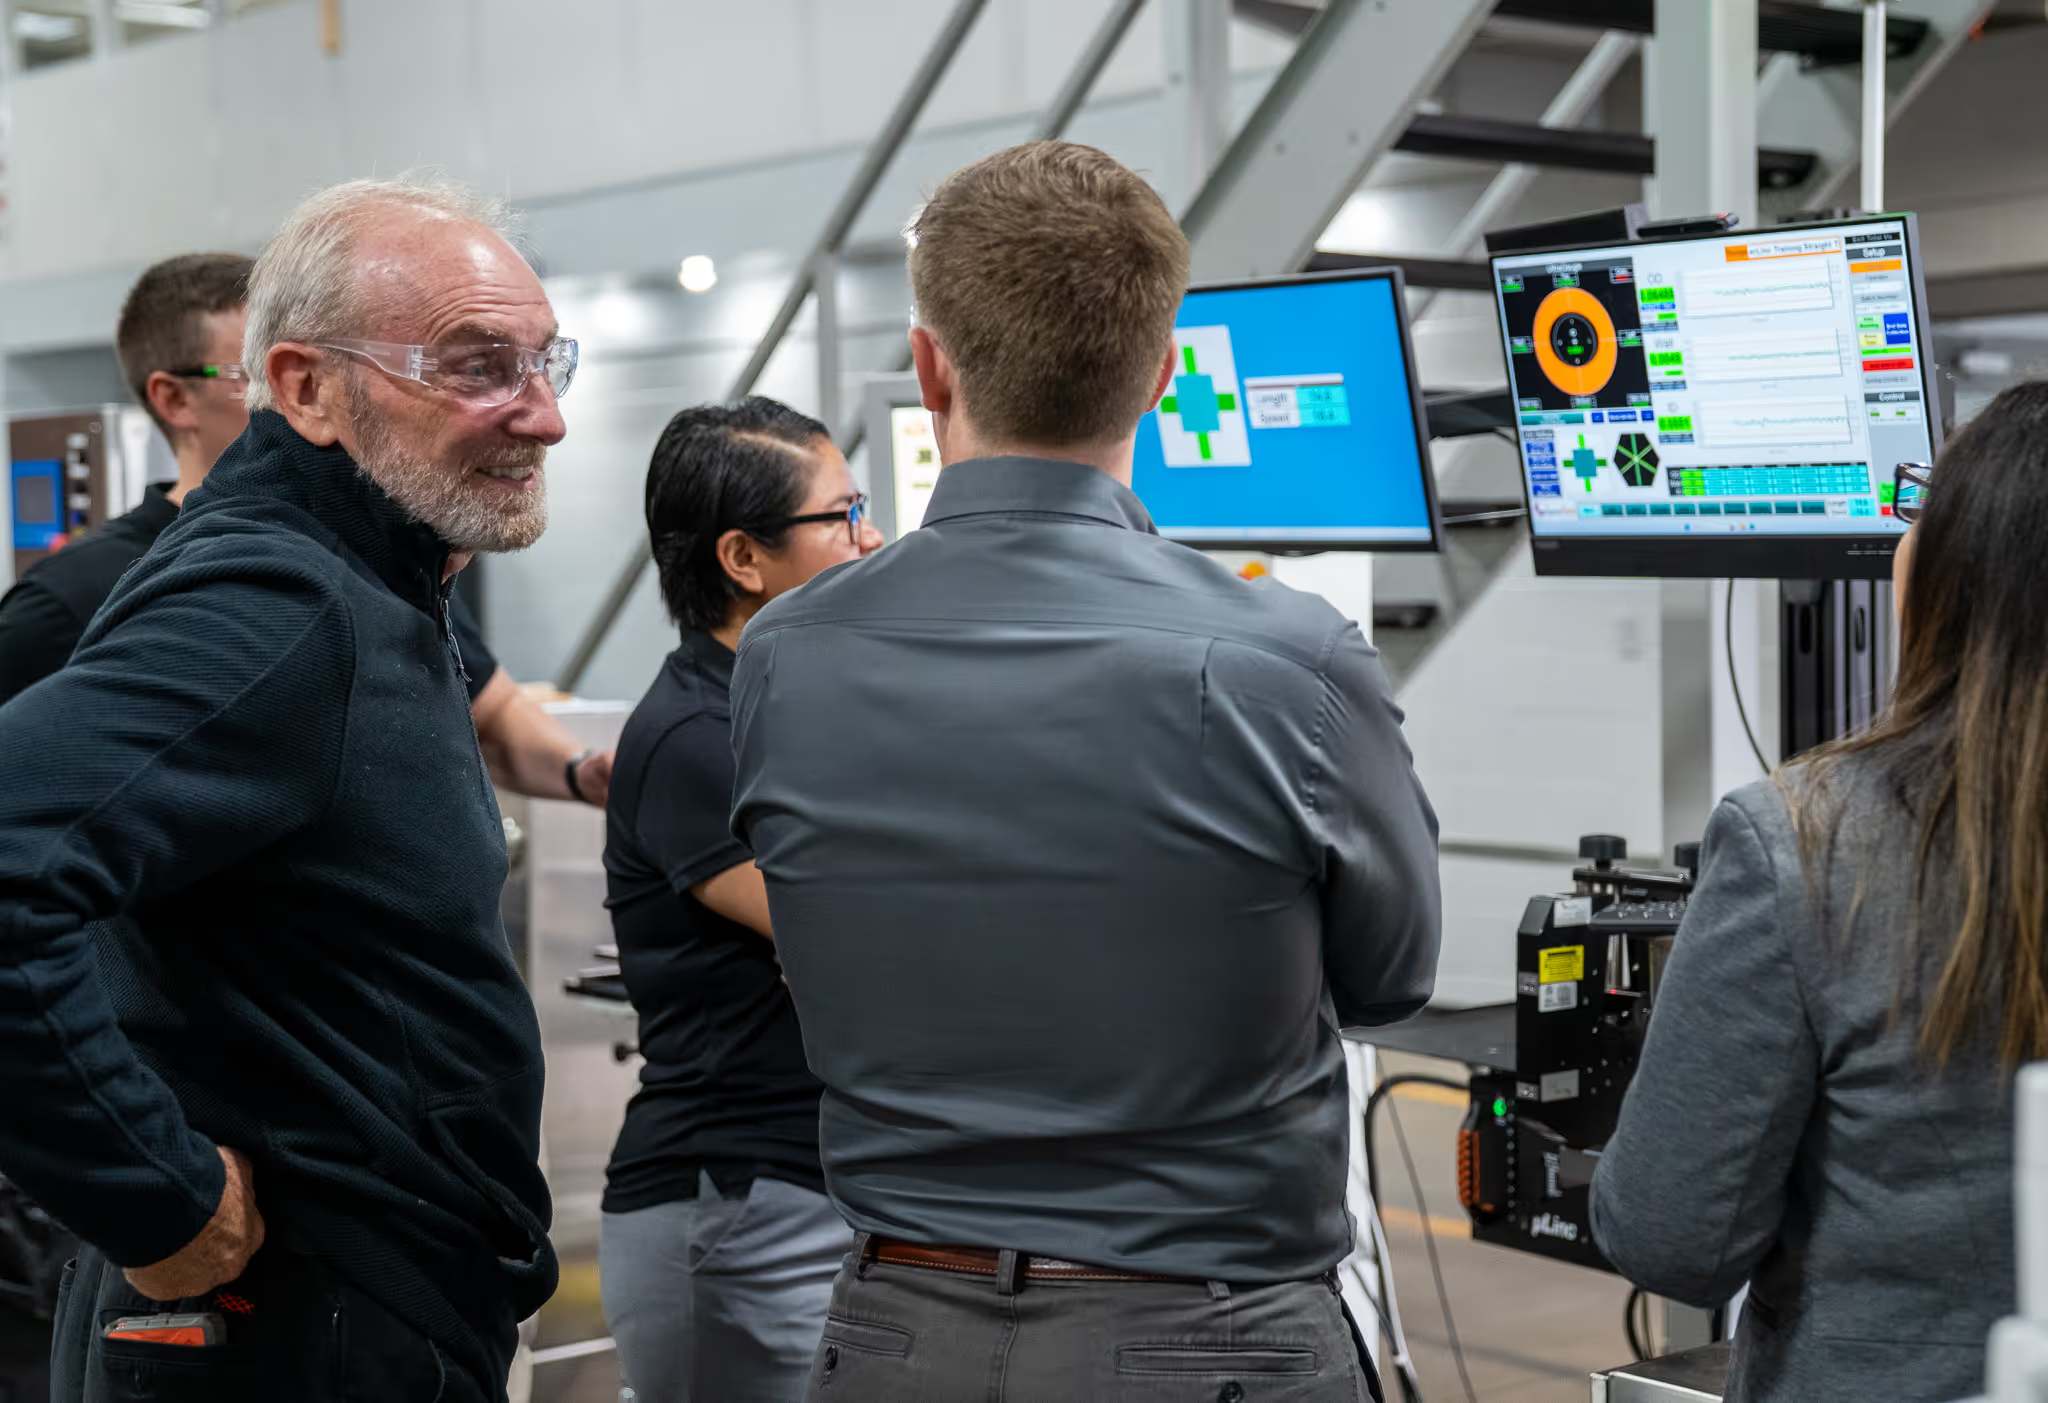
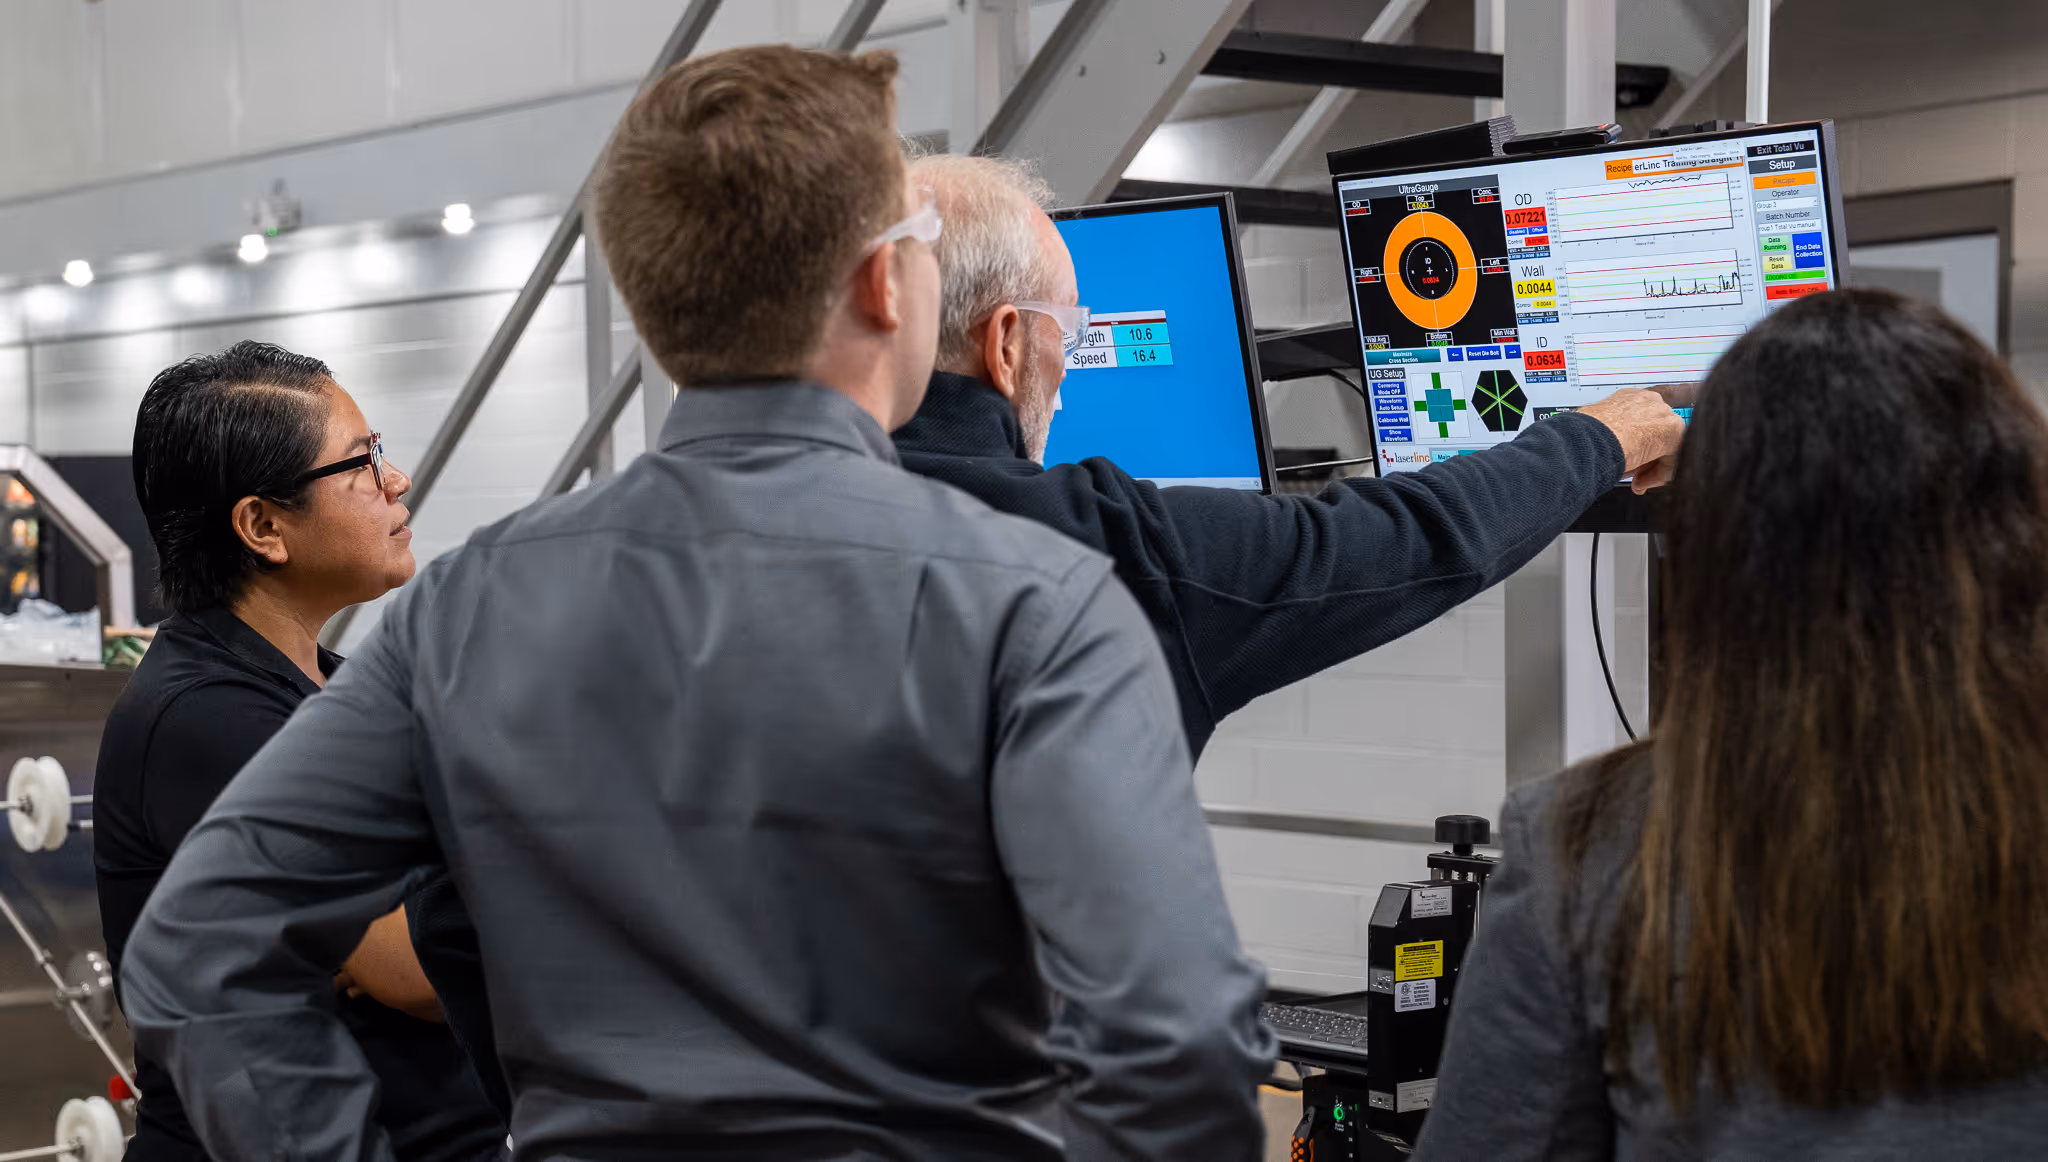
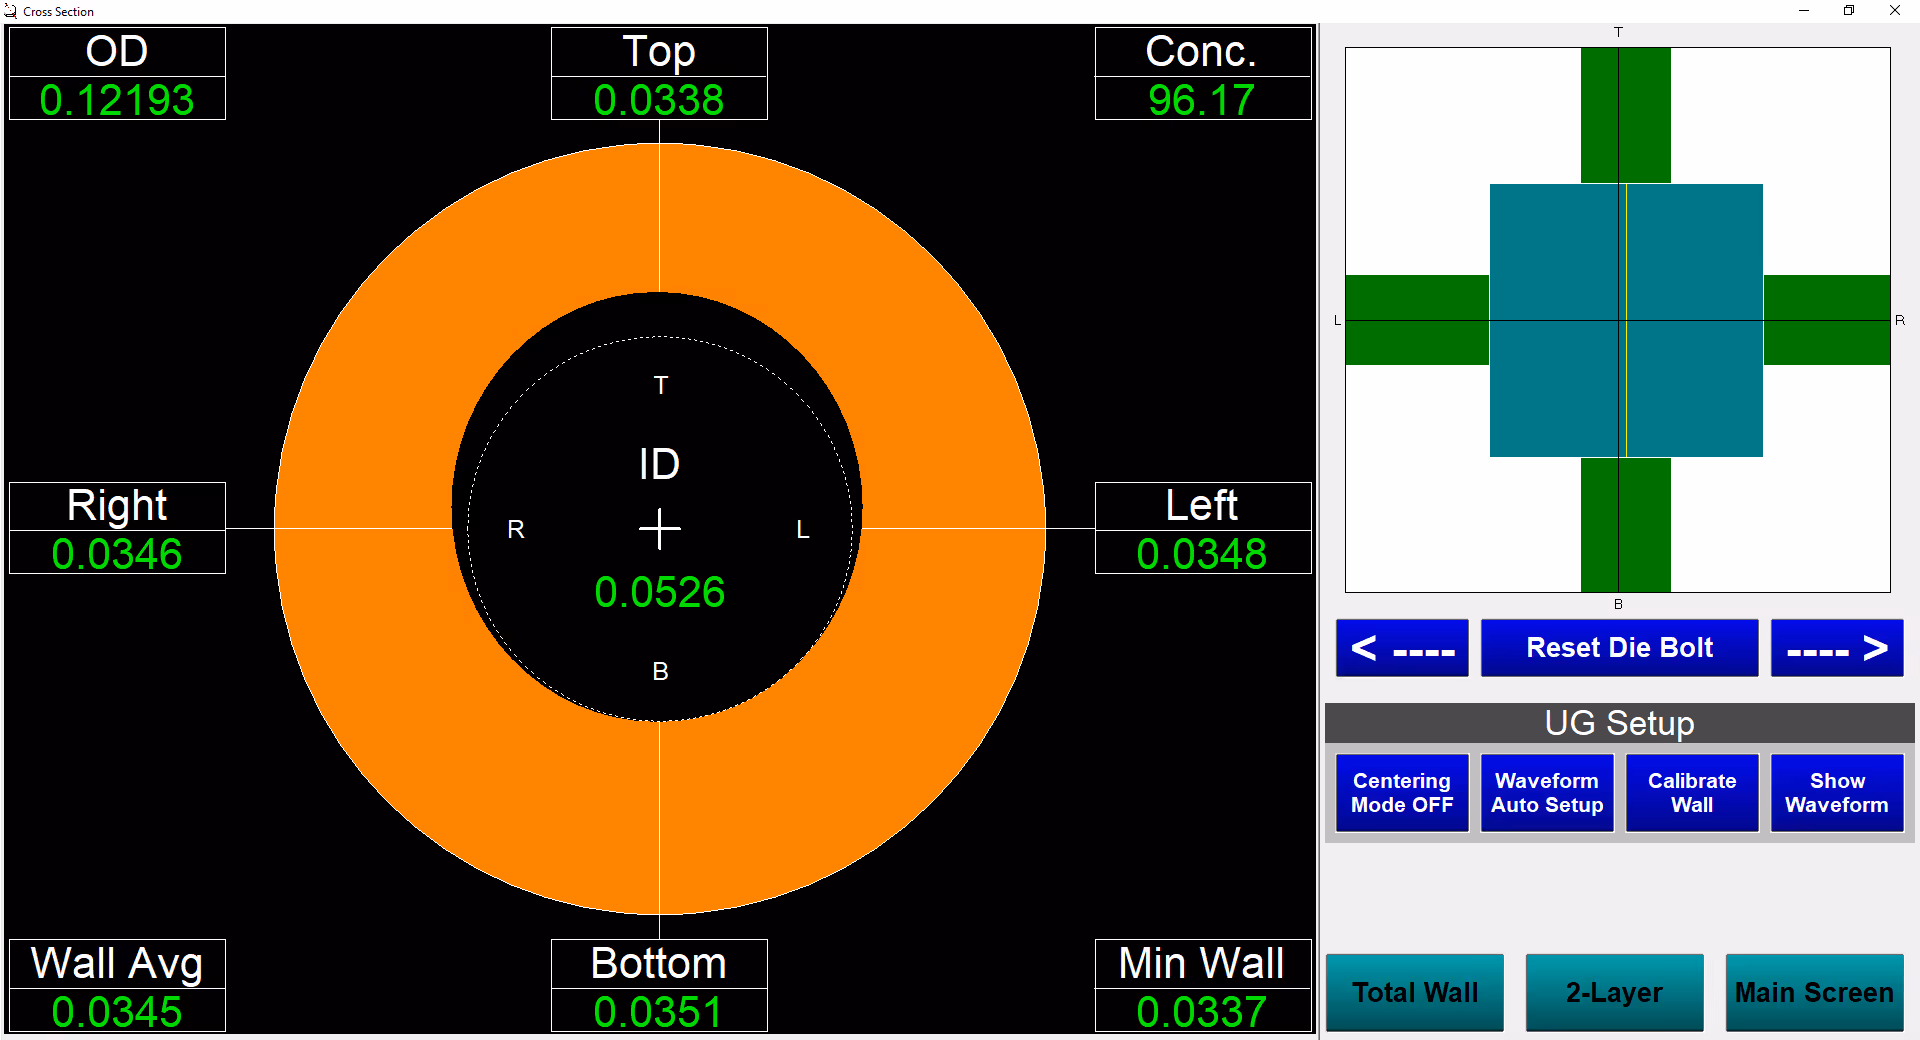
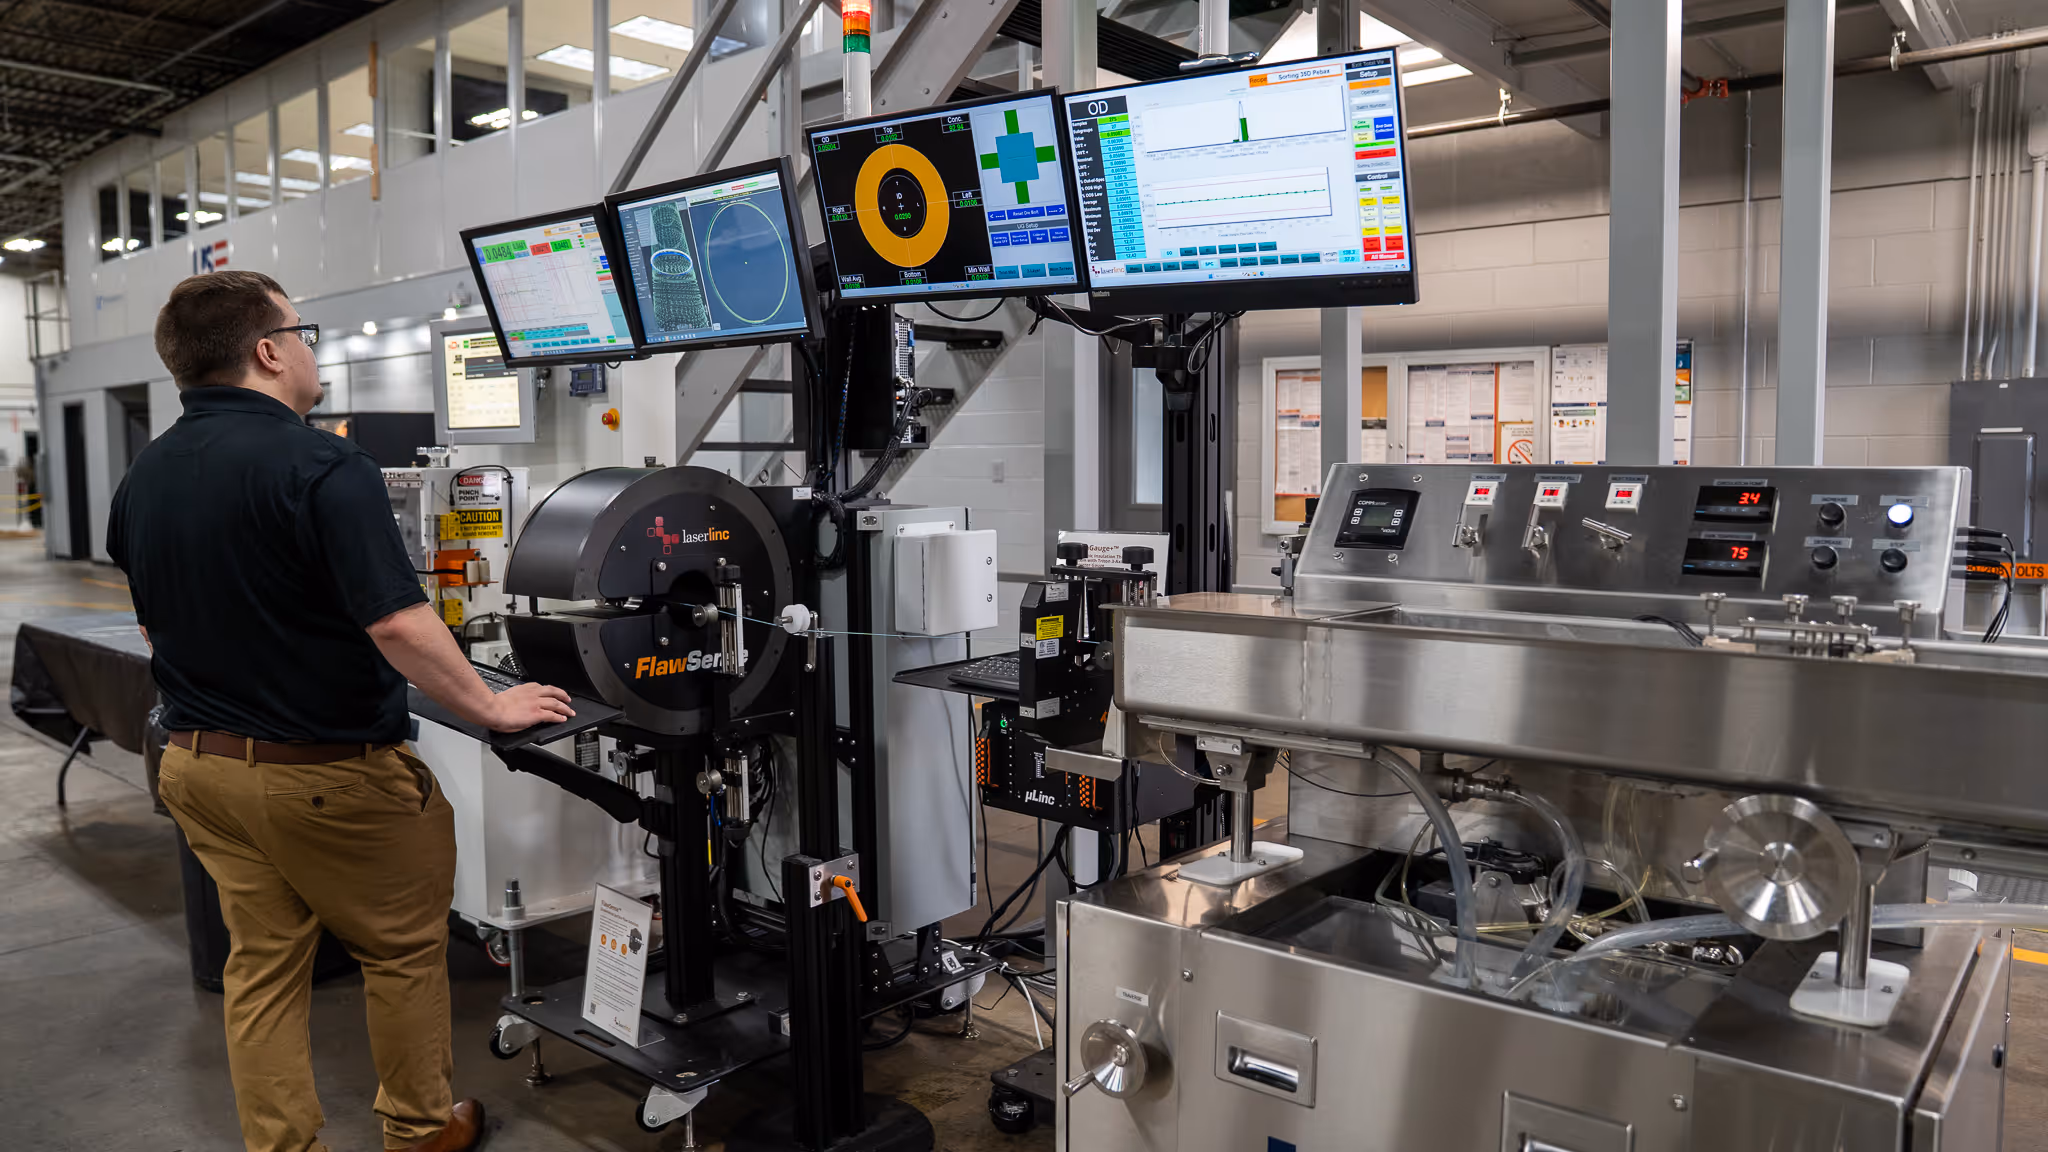
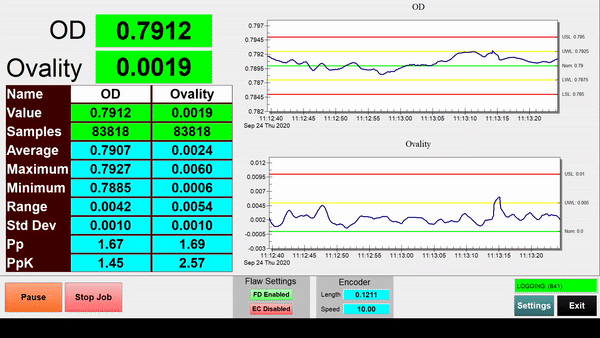
The Total Vu™ HMI is the core of most LaserLinc systems, and you'll see many screenshots throughout our site. Our HMI brings together any combination of our Triton™ and Axion™ laser micrometers, UltraGauge™ wall thickness and concentricity measurement devices, and FlawSense™ defect detection and advanced measurement products.
Every system ships with a standard application configuration. Every configuration is built on the Total Vu platform since it isn’t just a set of features–it is a set of tools. With a variety of visualization, analytical, documentation, and other tools in your toolbox, our application configurations are adaptable to your unique requirements and workflows, now and in the future.
When you bring it all together, you have all the power you need to run your production line, make informed decisions, and accomplish your business objectives.
Imagine it. Build it.
With an extensive set of tools developed over 30 years of working across many industries with thousands of people, the question we ask is: What do you want to do with the measurement data?
If our native tools aren't enough, integrate third-party equipment, information from other devices on your line, or tie in your Enterprise software using communications from our toolset. The possibilities are limitless.
Free yourself of the restrictions of other systems. No custom engineering required since the tools are already made. Imagine what you want, and we'll help you build it.
Our tools. Your success.
Designed with you in mind
With the support you want.
Explore the possibilities.
Here to help you deliver results.
- Improve revenue through higher production rates and improved quality for competitive advantage.
- Decrease costs through scrap reduction, faster startup, material savings, automation, and enterprise connectivity.
- Innovate your processes and products.
- Decrease compliance risk with reporting and data to verify quality.